Principal speaker
Sharron Stapleton
Visualising data can help us understand complex information quickly. Transforming data into a visual format can:
*reveal patterns and relationships
*identify trends and
*communicate insights with impact.
This hands-on workshop will explore methods and tools to create publication quality visualisations of complex, structured data from spreadsheets. Visualisation models include:
*Scatterplots: a mathematical diagram using Cartesian coordinates to display values for two variables for a set of data.
*Dendrograms: tree-like diagrams used to represent the distribution of a hierarchical clustering
*Alluvial diagrams: represent flows and to see correlations between categorical dimensions, visually linking to the number of elements sharing the same categories
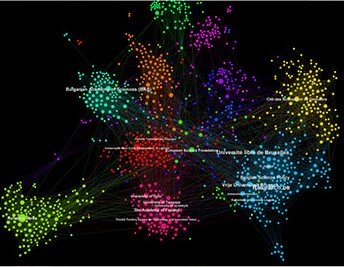
*Network diagrams: represent relationships between actors or nodes utilising mathematical language of graph theory
Using open source software, Gephi and Raw Graphs, participants will create visualisations using open data from data.qld.gov.
This workshop is aimed at researchers and HDR candidates and requires no coding skills.
BYO Laptop.
Learning outcomes:
Participants can apply an appropriate visualisation model for a dataset
Participants can create a visualisation from tabular data
Participants can export or save a visualisation in a publication quality file format.
Event categories
RSVP
RSVP on or before Friday 14 February 2020 , by email RED@griffith.edu.au , or by phone 0755529107 , or via http://events.griffith.edu.au/d/qhqf6z/4W