Principal speaker
Sharron Stapleton
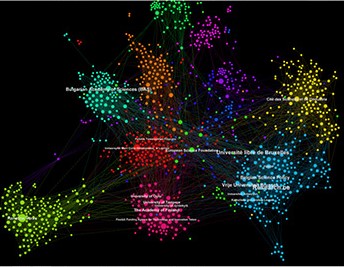
Visualising data can help us understand complex information quickly. Transforming data into a visual format can:
reveal patterns and relationships
identify trends
communicate insights with impact
This online session will explore methods and tools to create publication quality visualisations of structured data from spreadsheets. Tools covered include MS Excel and Adobe Acrobat DC, along with open source software Voyant and Raw Graphs.
This will not be hands-on session, but a live demo with questions etc., however you may follow along if you wish to.
At the end of this session, you will be able to:
identify an appropriate tool to visualise data
create a visualisation from tabular data
export or save a visualisation in a publication quality file format
Required:
Computer (if you wish to follow along)
Mobile device for back-up online communication
This workshop is aimed at researchers and HDR candidates and requires no coding skills.
Event categories
RSVP
RSVP on or before Friday 12 June 2020 , by email RED@griffith.edu.au , or by phone 0755529107 , or via http://events.griffith.edu.au/d/2nqgh7/4W